
Case Study: Automating Social Media Statistics Downloads for Media Marketing Team
Solution: AI Workflows & Process Automation

Executive Summary
A social media marketing team was spending approximately three hours per week manually collecting performance statistics from Instagram Reels and updating a tracking spreadsheet. This repetitive, low-value task was projected to grow to five to six hours weekly as content volume increased. By implementing an automated workflow using n8n, the organization eliminated over 90% of this manual effort while simultaneously improving data accuracy and timeliness.
The solution leverages the Instagram Graph API to automatically retrieve reel statistics, uses AI to generate content summaries, and writes the data directly to Google Sheets with intelligent upsert logic. The workflow runs daily on a schedule and can be triggered on-demand for ad-hoc reporting needs.
Key Results:
90%+ reduction in manual data collection time
Daily automated updates replacing twice-weekly manual processes
Projected 3-year ROI of $52,000+ in labor savings
Eliminated data entry errors inherent in manual transcription
Enabled faster, data-driven marketing decisions
The Situation
The marketing team manages a growing Instagram presence focused on brand awareness, product promotion, and industry insights. The team publishes Instagram Reels three times per week as a core component of their social media strategy. To measure content performance and inform future creative decisions, the marketing manager tracks key metrics for each reel in a Google Sheets spreadsheet.
The Manual Process
Twice weekly, the marketing manager performed the following routine:
1. Log into Instagram’s native analytics interface
2. Navigate to each individual reel posted
3. Record performance metrics including: Total views, Unique visitors (reach), Likes, Reposts/shares, Follows attributed to the reel
4. Manually enter each metric into the corresponding row in Google Sheets
5. Update the “last updated” timestamp for each entry
6. For new reels, create a new row with reel identification, posting date, and initial metrics
Pain Points
Time Consumption: The process required approximately three hours per week, representing a significant allocation of skilled marketing resources to repetitive data entry.
Scalability Concerns: As the content library grew, the time required scaled linearly. With the team planning to increase posting frequency and with the existing backlog of reels requiring ongoing tracking, the projected time burden was expected to reach five to six hours weekly within the next six to twelve months.
Data Freshness: With updates occurring only twice weekly, the team often made creative decisions based on metrics that were two to three days old, potentially missing emerging trends or underperforming content that could be adjusted.
Error Potential: Manual data transcription introduced risk of entry errors, particularly when copying multiple numeric values across dozens of reels. A single transposed digit could skew analysis and lead to incorrect strategic conclusions.
Opportunity Cost: Hours spent on data collection were hours not spent on high-value activities such as content strategy, creative development, audience engagement, and campaign optimization.
Quantifiable Business Impact
Key Results at a Glance
⏱ 2 ¾ hrs saved per week
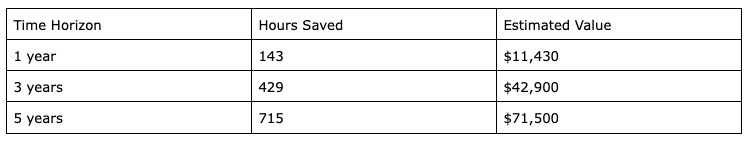
📈 143+ hours (3.6 weeks) reclaimed annually
🚀 Faster turnaround, minimize errors, operational leverage -> can spend time on more high value, strategic work
Time Savings Scenario
Hourly rate: $100 / hr
Current weekly manual effort: 3 hrs
Project future manual effort: 5.5 hrs
Post-automation weekly effort: 0.25 hrs (i.e. 15 min, peruse / check results)
Total savings per week: 2.75 hours x $100 / hr = $275 / week
Financial ROI
** Assuming $100 / hour
Intangible Benefits
Beyond direct labor savings, the automation delivers additional value that is difficult to quantify but strategically significant:
Improved Decision Velocity: Daily data updates enable faster identification of high-performing content and rapid iteration on successful formats.
Reduced Cognitive Load: Eliminating repetitive tasks improves job satisfaction and allows the marketing manager to focus on creative and strategic work.
Data Integrity: Automated collection eliminates transcription errors, improving confidence in analytics-driven decisions.
Audit Trail: Automated timestamps and consistent data formatting create a reliable historical record for trend analysis.
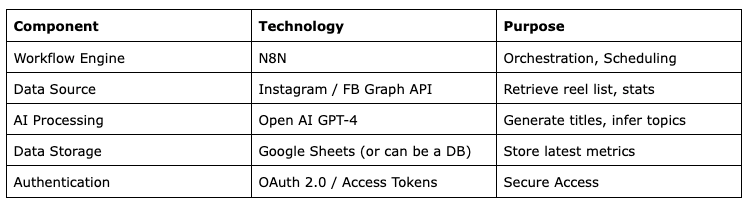
Solution Overview (High Level)
The solution is built on n8n, an open-source workflow automation platform that provides visual workflow design, extensive integration capabilities, and self-hosted deployment options for data privacy.
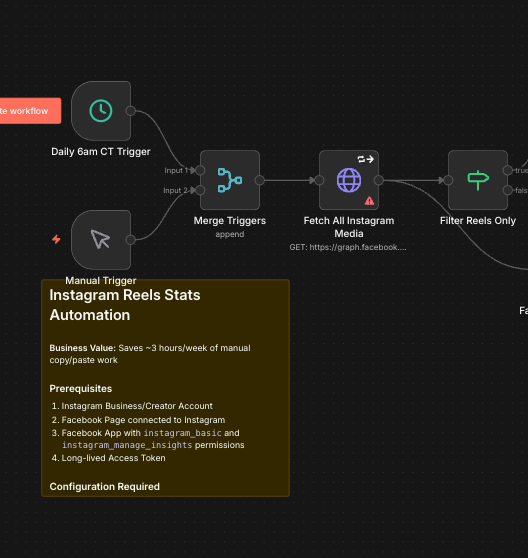
Workflow Trigger: The automation executes daily at 6:00 AM Central Time via a scheduled trigger. A manual trigger is also available for on-demand execution when immediate data refreshes are required.
Data Retrieval: The workflow connects to the Instagram Graph API (via Meta’s Facebook Graph API infrastructure) to retrieve a complete list of reels and their associated performance metrics.
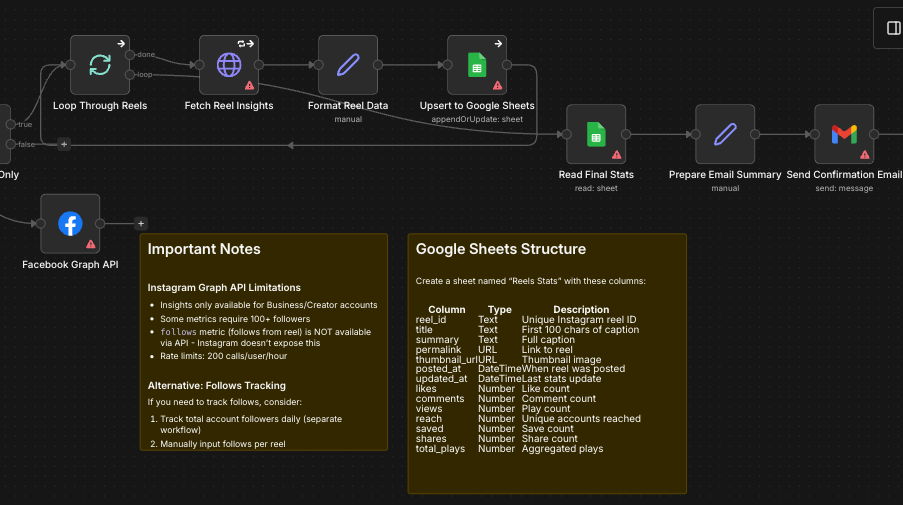
AI Enhancement: For each reel, the system retrieves the video transcript and passes it to an AI language model to generate a concise title and topic classification, reducing manual content cataloging effort.
Data Persistence: Processed statistics are written to Google Sheets using an upsert pattern. Existing reels (matched by unique reel ID) have their statistics updated in place, while new reels are appended as new rows.
Notification: Upon completion, the workflow sends a summary email to the marketing administrator confirming successful execution and highlighting any anomalies.
Solution / Workflow Detail
The workflow includes distinct nodes for
Automated and manual triggers
Instagram / FB graph API integration to retrieve reels and reel statistics
Calling AI / LLMs w/ transcript to infer titles and topics
Merge of stats and upsert into data source for further reference / analysis
Notify admins of report readiness
Additional Directions
The solution here saves on costs for the marketing team, which is a significant win. However, we can help the business gain further leverage by extending automation orchestration to other parts of the team’s workflow, including sourcing ideas on social media for additional posts and topics, aggregating top and popular / trending topics, and persisting historical trends for further historical analysis.
Multi-Platform Social Listening: Similar automation can monitor Reddit, X (Twitter), LinkedIn, and other platforms to identify trending topics in the company’s domain. This intelligence can inform content strategy and ensure messaging remains relevant to current conversations.
Competitive Intelligence: Automated tracking of competitor social media performance can provide benchmarking data and identify successful content patterns worth emulating.
Revenue-Generating Applications: While this initial automation focuses on cost reduction, future iterations can directly drive revenue:
Automated identification of high-engagement content for paid promotion
Trigger-based alerts when content goes viral, enabling rapid response
Predictive Analytics: Historical performance data collected by this workflow creates a foundation for machine learning models that can predict content performance and optimize posting schedules.
Conclusion
The Instagram Reels statistics automation demonstrates how targeted workflow automation can eliminate repetitive manual processes, reduce costs, and improve data quality. With a payback period of less than two months and significant savings across multiple years, the investment delivers compelling returns while freeing marketing resources to focus on strategic, creative work that drives business growth.
The solution’s modular architecture and extensible design position the organization to expand automation capabilities across additional platforms and use cases, multiplying the value of the initial investment over time.